Connect with us

How To

How to Enable Google Chrome Developer Tools Now: A Step-by-Step Guide

Published

on

How to Enable Google Chrome Developer Tools Now: A Step-by-Step Guide

Google Chrome Developer Tools — often called DevTools — are a built-in suite of utilities that help web developers inspect, debug, and optimize websites directly in the browser. Whether you are a seasoned coder or just starting out, learning how to enable these tools can dramatically improve your workflow. This guide explains everything you need to know, from basic activation to mastering advanced features.

Why You Should Enable Google Chrome Developer Tools

Enabling Google Chrome Developer Tools unlocks a range of powerful capabilities that streamline the development process. Instead of switching between an editor and a browser, you can make live edits, test performance, and fix bugs in real time. This section breaks down the main reasons developers rely on DevTools daily.

Inspect and Edit Live Code

The Elements panel lets you view the HTML and CSS of any webpage. You can select an element, change its styles, and see updates instantly. This makes it easy to troubleshoot layout issues or experiment with design changes without altering source files.

Measure Performance in Real Time

The Performance panel records browser activity while you interact with a page. You can identify slow scripts, heavy images, or inefficient animations. By analyzing this data, you can optimize your site for faster load times and smoother scrolling.

Debug JavaScript Efficiently

The Console panel is your command center for running and testing JavaScript code. You can type commands, inspect variables, and catch errors on the fly. This saves hours compared to traditional debugging methods.

Test Across Devices and Browsers

With Device Mode, you can simulate how your site looks and behaves on smartphones, tablets, and different screen sizes. This ensures a consistent user experience across platforms without needing physical devices.

How to Enable Developer Mode in Chrome

Activating DevTools is simple and can be done in three ways. Choose the method that suits your workflow:

  • Keyboard shortcuts: On Windows or Linux, press Ctrl + Shift + I. On Mac, use Command + Option + I.
  • Right-click menu: Open any webpage, right-click on an element, and select Inspect from the context menu.
  • Chrome menu: Click the three-dot icon in the top-right corner, go to More tools, and choose Developer tools.

Once opened, the DevTools panel appears at the bottom or side of your browser window. You can dock it to the right, left, bottom, or pop it out as a separate window.

Understanding the Core Panels of Chrome DevTools

Each panel in Google Chrome Developer Tools serves a specific purpose. Here is an overview of the most important ones:

Elements Panel

This panel displays the DOM tree of the current page. You can edit HTML tags, modify CSS properties, and add new elements in real time. All changes are visual, so you see the results immediately.

Console Panel

The Console is where you run JavaScript commands and view log messages. It also shows errors, warnings, and network issues. Use it to test code snippets and debug scripts interactively.

Sources Panel

This panel gives you access to all files loaded by the page, including JavaScript, CSS, and images. You can set breakpoints, step through code, and make persistent edits. It is essential for in-depth debugging.

Network Panel

The Network panel records all network requests made by the page. You can see loading times, request headers, and response data. Use it to identify slow resources or optimize API calls.

Performance Panel

Record a session to see a timeline of events, including scripting, rendering, and painting. This helps pinpoint bottlenecks that affect page speed. You can also simulate different network conditions to test performance under various scenarios.

Memory Panel

Monitor JavaScript memory usage and take heap snapshots. This panel helps detect memory leaks and optimize resource consumption. It is particularly useful for single-page applications that run for extended periods.

Advanced Features and Tips for Using Chrome DevTools

Beyond the basic panels, DevTools offers several advanced capabilities that can further enhance your development experience:

  • Device Mode: Simulate mobile devices, rotate the screen, and test touch events.
  • Application Panel: Inspect local storage, session storage, cookies, and service workers.
  • Lighthouse: Run automated audits for performance, accessibility, SEO, and best practices.

For more insights, check out our guide on 5 Easy Ways to Install and Manage Google Chrome Extensions to complement your DevTools workflow.

Optimizing Your Website with DevTools

Regular use of Google Chrome Developer Tools allows you to catch issues early, improve load times, and ensure cross-device compatibility. You can also customize the DevTools layout and settings to match your preferences. For example, you can enable dark mode, adjust font sizes, or disable caching while debugging.

Additionally, exploring Chrome tips and tricks can help you become more productive. Many developers also use DevTools to analyze competitor websites, learning from their structure and performance strategies.

Winding Up

Enabling and mastering Google Chrome Developer Tools is a vital skill for any web developer. From live code editing to performance analysis, these tools provide everything you need to build and maintain high-quality websites. Start by activating DevTools using one of the simple methods above, then explore each panel at your own pace. With consistent practice, you will quickly see improvements in your development speed and code quality.

Continue Reading
Click to comment

Leave a Reply

Your email address will not be published. Required fields are marked *

Social Media

X opens up its ranking algorithm — and finally lets users check for shadowbans

Published

on

X open sources algorithm

X just made a massive chunk of its code public

On Thursday, X announced it’s significantly expanding its open source codebase — and for the first time, users will be able to see if their account or posts have been quietly suppressed by the platform’s ranking systems.

The company is releasing the source code for the “For You” timeline — the default feed you see when you open the app — on GitHub under the Apache v2 license. That’s a big deal on its own, but the move goes further. X is also opening up parts of its code that were previously closed, including model configuration, filters, and core ranking system details. That means the parameters used to weight different signals — the stuff that determines which posts actually surface — are now out in the open.

This makes the codebase roughly 10 to 15 times larger than it was before. Not exactly a small gesture.

What’s actually in the open source release?

According to X’s VP of Product, Keith Coleman, the release gives you the core ranking code that pulls posts, ranks them for any given user, and assembles the feed. But that’s not all.

“You can see the systems that filter out potentially problematic, rule-violating content,” Coleman told TechCrunch. “And some of those systems, like the ranker and the score, you can even run yourself outside the company.”

That’s a notable shift. Previously, X’s algorithm was a black box — even to developers who wanted to understand why certain posts got buried. Now, anyone with the technical chops can run the ranking system themselves.

Coleman admitted this level of openness might surprise people. “This is the kind of thing that I think people will be fairly shocked that we are releasing,” he said.

A new transparency tool for regular users

Of course, not everyone is going to dig through GitHub repositories. So X is also rolling out a transparency tool that’s actually accessible to everyday users.

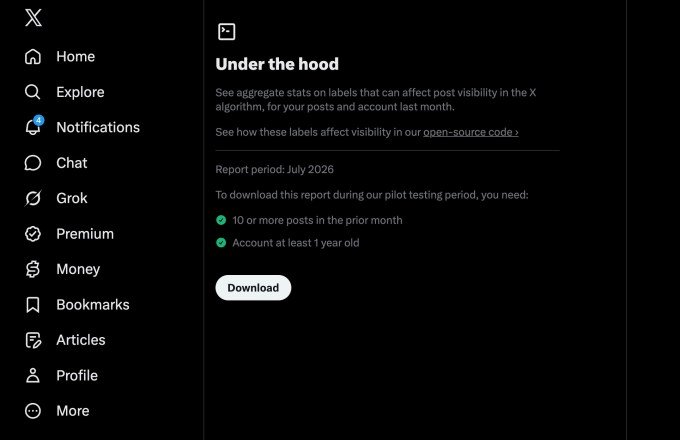
The new feature lives on an “Under the Hood” page in the app’s settings. It’s currently being tested with a pilot group of accounts that are at least a year old, and it will roll out more broadly later.

Here’s how it works:

  • If you’ve posted 10 or more times in the past month, you can download your aggregate stats as a JSON file.
  • The file shows whether any labels have been applied to your account or posts over the past calendar month.
  • That tells you if you’ve been shadowbanned or otherwise impacted by X’s ranking systems.

Not a technical user? No problem. X suggests you can drop the JSON file into an LLM of your choice, point the AI at X’s GitHub repo, and ask for an interpretation. It’s a practical workaround for people who want answers without learning to code.

External researchers already tested the code

Before the public release, X previewed the codebase to external researchers who specialize in recommendation systems. Those researchers were able to train and run X’s Phoenix scoring system using the open source code — a major milestone, according to Coleman.

Developers can now submit pull requests to the GitHub repository, and X engineers will consider incorporating those updates into the algorithm. Not every suggestion will make the cut, but Coleman is clearly excited about the possibility.

“That would be amazing to have people submitting code that improves the algorithm,” he said. “I mean, how cool would it be for the X algorithm to be not just visible to the public, but also, like, by the public?”

What’s not included (and why)

There are some gaps. Systems that use Grok to predict whether a post might violate a rule are not part of this release. X says that’s intentional — to prevent bad actors from using the code to work around the rules and flood the network with spam.

So while the release is substantial, it’s not total. The company is keeping some cards close to its chest.

Why this matters for shadowban concerns

The changes are aimed at addressing long-standing concerns about how X’s algorithm influences politics, elections, and the spread of misinformation. The platform has been home to political figures and high-profile individuals for years, and it’s now owned by a trillionaire who helped President Trump get elected.

But the transparency issues predate Musk’s ownership. Republicans in Congress alleged years ago that Twitter leaned too far left and claimed the network had “shadowbanned” their posts — making them invisible or undiscoverable without the user’s knowledge. Twitter consistently denied those claims.

Coleman says the goal is to let the public assess how posts are distributed, vet that it’s a level playing field, and critique it if it’s not.

“That’s the whole goal of this: [the code] can be audited; it can be critiqued,” he said. “We’re going to listen, and we want to make the system one that people like and trust, and feel is fair.”

The bigger picture: transparency vs. privacy

There’s some irony here. While X is pushing for more transparency around its code, the company has arguably become less transparent overall under Musk. As a private company, it’s no longer required to report to the SEC, and it’s been less forthcoming about user metrics, growth, revenue, and government takedown requests.

Now that X has merged with SpaceX, its monthly active users are once again public. But the broader picture is mixed — more open in some ways, less in others.

Still, for users who’ve wondered whether their posts were being suppressed, this is a meaningful step. The ability to check your own account’s status, combined with the open source code, gives people a way to verify what’s happening rather than just speculating.

Whether it’s enough to rebuild trust remains to be seen. But it’s a start — and it’s a lot more than most social platforms offer.

Continue Reading

How To

I Ditched Task Manager for a 17-Year-Old Free App That Puts It to Shame

Published

on

free app beats Task Manager

Task Manager Has a Blind Spot

For as long as I’ve used Windows, Task Manager has been my go-to for checking hardware usage or hunting down rogue processes. But honestly? I stuck with it out of habit, not because it’s the best tool for the job.

That hit me hard last week. My CPU was pinned at a steady 40 percent, and the culprit was dllhost.exe. Task Manager showed me the process name and its CPU number — and that was it. No details on which DLL it was hosting, no file path, no way to dig deeper. I was staring at a black box.

Enter Process Explorer: A 17-Year-Old Veteran

Then I remembered a tool I’d used years ago: Process Explorer. First released in 2001, this free utility from Microsoft’s Sysinternals suite is still actively maintained. It’s often called Task Manager on steroids — and for good reason.

Within minutes of launching it, I could see exactly what dllhost.exe was doing. Process Explorer reveals the command line, the full path to the executable, and even the specific COM object the process is hosting. That one insight turned a frustrating guessing game into a quick fix.

What Process Explorer Does That Task Manager Can’t

  • Tree view: See parent-child relationships between processes, so you know what spawned what.
  • Full details: Double-click any process to get a mountain of tabs — performance, threads, TCP/IP, environment variables, and more.
  • DLL and handle search: Use Ctrl+F to find which process has a file or DLL locked. Task Manager can’t do this at all.
  • Color-coded processes: Services are pink, processes are blue, and new items flash green — you can spot changes instantly.

Why a 17-Year-Old App Still Wins

You’d think a tool that predates Windows XP would feel dated. Process Explorer doesn’t. It’s been updated consistently, and it supports 64-bit systems, high-DPI displays, and modern Windows versions up to Windows 11. It’s free, portable (no installation needed), and runs on any Windows PC.

Task Manager has improved over the years — the Windows 10 and 11 versions are far better than the old XP-era one. But it still hides the deep technical data that power users crave. Process Explorer hands it to you on a silver platter.

If you’re troubleshooting a dllhost.exe high CPU issue or just want to understand what your computer is really doing, this is the tool to grab. It’s also a lifesaver for finding which process is using a specific file — something Task Manager simply can’t do.

How to Get Started

Download Process Explorer from the official Sysinternals site. Unzip the folder, run procexp64.exe (or procexp.exe on 32-bit systems), and you’re in. It doesn’t even need admin rights for basic viewing, though you’ll want to run it as administrator to see full details on system processes.

Replace Task Manager in your muscle memory. The learning curve is gentle — the interface looks familiar, but every click reveals more depth. Once you’ve used Process Explorer, going back to the default tool feels like driving a car with a blindfold on.

So next time your CPU spikes and Task Manager gives you nothing but a name and a number, remember: there’s a free 17-year-old app that runs circles around it. Give it a try.

Continue Reading

How To

Stop settling for Android’s surface-level automation—Tasker does what Google won’t

Published

on

Tasker automation

Why Android’s built-in automation feels shallow

Most people have dabbled with the smart automation features baked into our phones. Between Samsung’s routines, Google Assistant, and the newer Gemini integrations, it feels like there are plenty of ways to automate a job. But here’s the thing: I’ve always found them disappointingly surface-level, especially when you stack them against the Shortcuts app on iPhones, which is genuinely stellar.

Android’s native tools are fine for the basics—turning on Wi-Fi when you get home, silencing notifications during a meeting. But the moment you want something even slightly unconventional, you hit a wall. Google’s approach is to hand you a few pre-baked recipes and hope you don’t ask for more.

That’s where Tasker automation steps in. It’s been around for over a decade, and it still does things that Google won’t even attempt.

Tasker isn’t just another automation app—it’s a toolbox

Tasker isn’t a single-purpose tool. It’s closer to a Swiss Army knife for your phone’s operating system. You build “profiles” that trigger “tasks” based on conditions you define—time, location, sensor data, app activity, even the content of a notification.

Want your phone to read out incoming texts when you’re driving? Tasker can do that. Want to automatically switch to grayscale mode at 10 PM to curb late-night scrolling? Done. Want to log every time you open Instagram and how long you spend there? Tasker will track it and even generate a report.

The real power, though, comes from its plugin ecosystem. Tools like AutoInput let you simulate taps and swipes, while Tasker’s built-in variables let you create logic loops that would make a programmer smile.

Tasker vs. Samsung Routines: No contest

Samsung’s Routines are slick and user-friendly, no doubt. But they’re also locked down. You can only use the conditions and actions Samsung decided to expose. Tasker, on the other hand, gives you root-level access if you’re willing to go that far, and even without root, it can reach into system settings that Samsung hides away.

Tasker vs. Google Assistant’s routines

Google Assistant routines are voice-first and cloud-dependent. That means they break when your connection is flaky, and they can’t do anything that requires local, real-time processing. Tasker runs entirely on your device, so it’s faster, more private, and infinitely more flexible.

What Tasker can do that Google won’t touch

Let’s get concrete. Here are five things I’ve personally set up with Tasker that would be impossible (or absurdly convoluted) with Google or Samsung’s tools:

  • Notification-based triggers: When a specific app sends a notification with certain text, Tasker can react—like auto-replying to a message from your partner when you’re in a meeting.
  • Sensor fusion: Combine accelerometer data, light sensor readings, and battery level to create a context-aware profile. For example, if the phone is face-down and the room is dark, it could assume you’re asleep and silence everything.
  • Variable manipulation: Store data across profiles, calculate things, and build complex decision trees. It’s like having a mini programming language in your pocket.
  • Auto-input simulation: With the AutoInput plugin, Tasker can physically tap buttons on your screen. That means you can automate apps that don’t offer any official automation hooks.
  • Tasker scenes: Create custom floating buttons or menus that appear over other apps. I’ve built a one-tap timer for my workouts that overlays any screen.

Getting started with Tasker: A quick primer

Tasker has a reputation for being intimidating, and honestly, it deserves it. The interface is dense, and the learning curve is steep. But the payoff is worth it, and there are ways to ease in.

Start with the built-in Tasker 101 tutorial, which walks you through your first profile. Then, browse the best Tasker profiles shared by the community—there are thousands of ready-made ones you can import with a single tap.

You’ll also want to grab a few essential plugins: Tasker itself, plus AutoInput, AutoNotification, and AutoTools. They’re paid, but they turn Tasker from a curiosity into a genuine workhorse.

Beginner mistakes to avoid

  • Don’t try to build everything at once. Pick one small automation and master it before moving on.
  • Read the variable names carefully. A single typo will break your profile silently.
  • Use the “Test” button on every action before you rely on it. Trust me, you’ll save yourself hours of debugging.

Is Tasker still relevant in 2025?

You might be wondering: with all the AI-powered automation coming from Google and Samsung, is Tasker still necessary? The short answer is yes—more than ever.

Gemini and Assistant are great at understanding natural language commands, but they’re still bound by the same API limitations. They can’t reach into the guts of your device the way Tasker can. And as Google continues to lock down Android’s internals for security, Tasker’s community keeps finding workarounds.

Moreover, Tasker has evolved. It now supports JavaScript, has a modernized UI, and integrates with Home Assistant for smart home automation. It’s not a relic; it’s a living project with a dedicated developer and a passionate user base.

The bottom line

If you’re happy with the surface-level automation that Google and Samsung offer, that’s fine. But if you’ve ever felt that nagging itch—the sense that your phone could do so much more—then Tasker automation is the answer. It’s not the easiest path, but it’s the most rewarding one.

Give it a weekend. Import a few profiles. Break something. Fix it. You’ll never look at your Android the same way again.

For more on getting the most out of your device, check out our guide on Android customization tips and advanced phone productivity tricks.

Continue Reading

Trending