How to Print Photos, Emails, and Documents From Android Without a Computer
Modern smartphones have turned into powerful productivity tools, and one of the most useful features is the ability to print from Android devices without ever touching a desktop or laptop. Whether you need to print a boarding pass, a family photo, or an important work email, your Android phone can handle it all wirelessly. This guide covers every method available, from built-in services to third-party apps, so you can choose what works best for your setup.
Why Print From Android?
Printing directly from your phone saves time and eliminates the hassle of transferring files to a computer first. You can send documents from anywhere in your home or office, as long as both devices are connected to the same network. This flexibility is especially valuable for remote workers, students, and busy families who need quick access to printed materials.
Moreover, Android’s printing ecosystem supports a wide range of file types, including PDFs, images, emails, and even text messages. With the right setup, you can print almost anything with just a few taps.
Using the Default Print Service on Android
Every Android device comes with a built-in printing framework. This is the simplest way to print documents from Android without installing extra software.
Enable the Default Print Service
To get started, open the Settings app on your phone. Navigate to Connected Devices > Connection Preferences > Printing. Tap Default Print Service and toggle it on. Note that menu names can vary slightly depending on your phone manufacturer and Android version.
Connect a Wireless Printer
Make sure your printer supports Wi-Fi or Bluetooth. Turn on the printer and put it in pairing mode. On your phone, the default print service will automatically detect compatible printers on the same network. If the printer doesn’t appear, check that both devices are connected to the same Wi-Fi network.
Print a Document or Photo
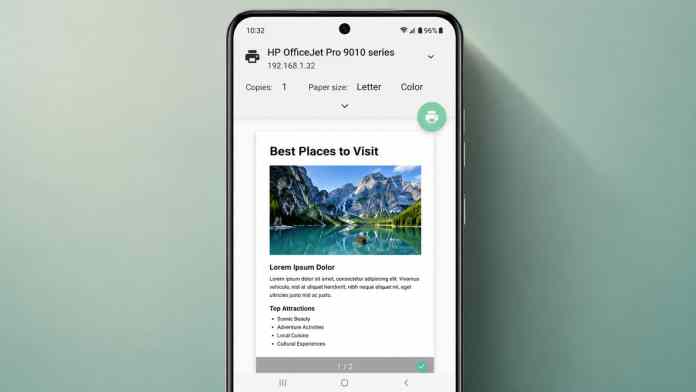
Open the file you want to print, tap the three-dot menu icon, and select Print. Choose your printer from the list, adjust settings like paper size and color, then tap the print button. This method works for photos, web pages, emails, and most document formats.
Printing With Manufacturer Apps
Printer companies often provide dedicated apps that offer better compatibility and extra features. Popular options include HP Print Service Plugin, Brother Printer Service Plugin, Canon Print Service, Samsung Print Service Plugin, and Epson iPrint.
Install and Use a Manufacturer App
Go to Settings > Printing > Default Print Service > Add Service. This will open the Google Play Store. Search for your printer brand’s app, install it, and return to printing settings to enable it. After setup, open any document, tap Print, and select the app as the print service. These apps often detect printers faster and provide advanced controls like paper tray selection and duplex printing.
Bluetooth Printing: Simple and Direct
Bluetooth printing is ideal for situations where Wi-Fi isn’t available. However, it has a limited range—usually around 30 feet—so keep your phone close to the printer.
Pair Your Phone With the Printer
Enable Bluetooth on both devices. On your phone, go to Settings > Bluetooth and scan for nearby devices. Select your printer from the list and enter a PIN if prompted. Once paired, the printer will appear in the print menu of any app.
Print Over Bluetooth
Open the file you want to print, select Print, and choose the paired Bluetooth printer. Review the settings and send the job. Avoid moving your phone out of range during printing, as disconnections can interrupt the process.
Wi-Fi Printing: The Most Popular Method
Wi-Fi printing is the preferred choice for most users because it offers fast speeds and a stable connection. Both the phone and printer must be on the same wireless network.
Set Up Wi-Fi Printing
Connect your printer to your home or office Wi-Fi network using its control panel. On your Android phone, go to Settings > Printing and enable the Default Print Service. The phone will scan for printers on the network. If your printer doesn’t appear, tap the three-dot menu and select Add Printer. You can enter the printer’s IP address manually or use Wi-Fi Direct.
Troubleshooting Printer Detection
If the printer still isn’t found, try installing the manufacturer’s app from the Google Play Store. These apps often discover printers that the default service misses. Restarting both the phone and printer can also resolve detection issues.
Third-Party Printing Apps
Several third-party applications expand Android’s printing capabilities. Mopria Print Service is a widely used option that supports thousands of printer models. Other popular choices include PrinterOn, Mobile Print PrinterShare, and PrintShare Mobile Print. Some offer free basic features, while advanced functions may require a subscription.
USB Printing: Wired and Reliable
USB printing is useful when wireless networks are unavailable or unreliable. You’ll need an OTG (On-The-Go) adapter that matches your phone’s charging port.
Connect the Hardware
Plug the USB cable into the printer, then connect the other end to the OTG adapter. Attach the adapter to your phone. Install a printing app like NokoPrint or PrintShare Mobile Print, which will guide you through driver installation. Once set up, open your document, choose Print, and select the USB-connected printer.
Printing Specific Content Types
Android makes it easy to print a variety of content without a computer.
Print Photos
Open Google Photos or your gallery app. Select the image, tap the menu icon, and choose Print. Adjust color and orientation settings, then send the job.
Print Text Messages
For a few messages, take a screenshot and print it. For longer conversations, use the Super Backup & Restore app. Install it, back up your SMS, then open the backup file and tap Print.
Print Emails
In Gmail or Outlook, open the email, tap the three-dot menu, and select Print. The email will print like a standard document, including headers and body text.
Modern Solutions: PaperCut Mobility Print
With Google Cloud Print discontinued, PaperCut Mobility Print has become a popular alternative. Install the app on your phone and connect both devices to the same network. Create an account, enable the service, and print documents after authentication. This solution works well in schools and offices that require user tracking.
Final Thoughts
Printing from an Android phone is no longer a novelty—it’s a practical, everyday feature. Whether you use Wi-Fi, Bluetooth, USB, or a dedicated app, the process is straightforward and reliable. By mastering these methods, you can print from Android anytime, anywhere, without relying on a computer.


 CyberSecurity4 months ago
 CyberSecurity4 months ago
 CyberSecurity4 months ago
 Social Media4 months ago
 Infosecurity4 months ago
 CyberSecurity4 months ago
 How To3 months ago
 CyberSecurity4 months ago